BI Tile Components
Hurdlr's Business Intelligence Embedded experience makes it easy for you to provide your users with an easily digestible overview of their business's key performance indicators. It also serves as a great way to onboard new users, as it gives them a glimpse of what kind of business intelligence they will receive by simply following a few quick onboarding steps.
1. How it works
Take a look at the various Business Intelligence Tiles available to you via the Hurdlr Embedded experience, including:
2. Initializing the Embedded Experience
To initialize the Hurdlr Embedded experience in your project, follow the instructions on Embedding Hurdlr's white-labelled UI.
3. Adding the Business Intelligence Tiles to your app
To render the Business Intelligence Tiles, you will need to provide the elementId parameter, which is the HTML id of the main <div> where you would like the Business Intelligence Tiles to render. When your user taps on your "Business Intelligence" or "Home" navigation CTA, you simply need to invoke the following line of javascript:
Hurdlr.renderScreen(elementId, 'biTiles', options);
4. Customizing the UI to match your branding
Hurdlr's API team can quickly customize the UI to match your branding. Please follow the instructions on Customizing the embedded UI to match your branding.
5. Modifying the displayed tiles
If you'd like to alter or re-order the tiles being displayed, you can do so by populating a biTiles array within the options object as follows:
Hurdlr.renderScreen(elementId, 'biTiles', { biTiles: [Hurdlr.biTiles.profitLoss, Hurdlr.biTiles.cashFlow, Hurdlr.biTiles.invoice]});
The tiles array can contain any of the following values:
| Value | BI Tile Name |
|---|---|
Hurdlr.biTiles.profitLoss | Profit & Loss |
Hurdlr.biTiles.cashFlow | Cash Flow |
Hurdlr.biTiles.invoice | Invoices |
Hurdlr.biTiles.expense | Expenses |
Hurdlr.biTiles.revenue | Income |
Hurdlr.biTiles.tax | Taxes |
6. Using the tiles to onboard new users
The Business Intelligence tiles give users a glimpse into what kind of intelligence they will receive once they complete a few simple onboarding steps, including linking a bank account and setting up their tax profile. To encourage your users to fully onboard, you should include the optional showOnboarding parameter in the options object as follows:
Hurdlr.renderScreen(elementId, 'biTiles', { showOnboarding: true, biTiles: [Hurdlr.biTiles.profitLoss, Hurdlr.biTiles.cashFlow, Hurdlr.biTiles.invoice]});
The above code will display applicable banners encouraging your users to complete the following key onboarding steps:
- Bank account linking
- Invoice setup, including ability to accept credit cards
- Tax profile setup
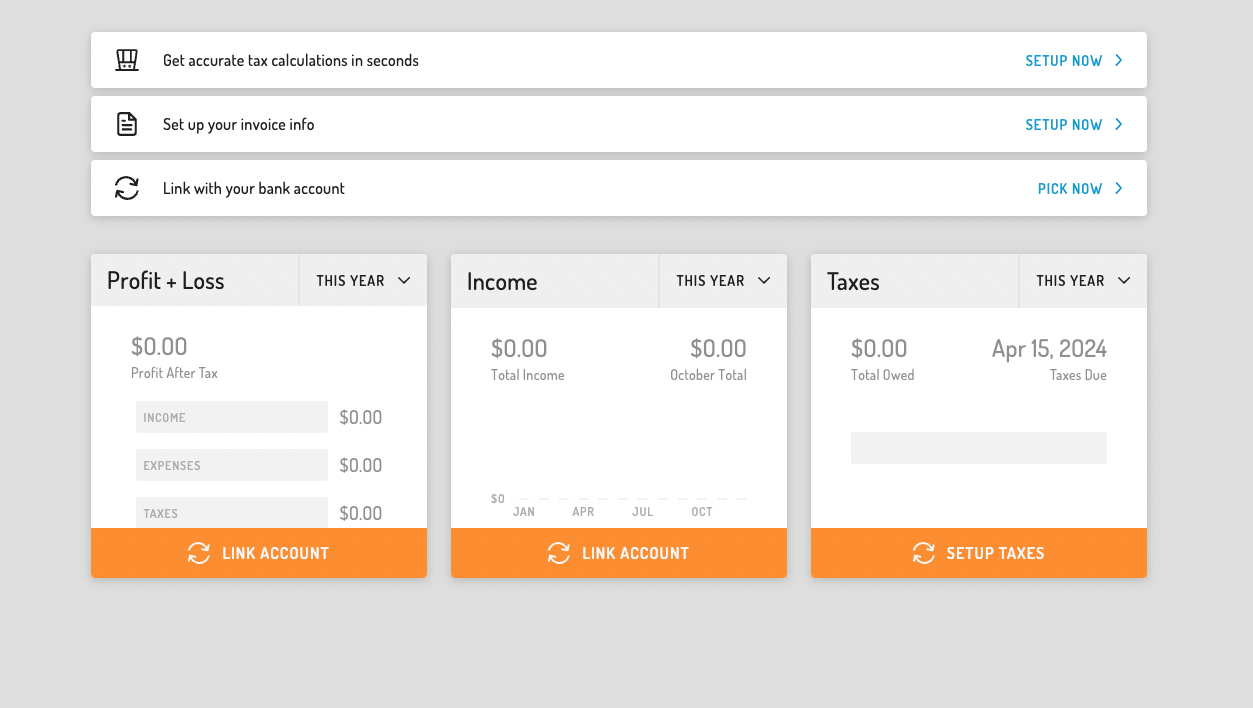
showOnboarding: true
Please note that the Hurdlr Embedded experience is smart enough to determine whether the given user has already completed onboarding. Therefore, if you want to utilize the BI Tiles onboarding in general, you can always set this flag to true, and the Hurdlr Embedded experience will decide whether the given user should be shown the onboarding UX based on whether the given user needs it. If your user completes onboarding, you do not need to set the
showOnboardingflag to false.
7. Routing the tiles
In order to control where your user is routed when they click on a BI tile, you will want to take advantage of the Hurdlr Embedded experience's registerBITileListener functionality. By registering a listener, the Hurdlr Embedded experience will invoke the callback function you provide whenever a CTA is pressed by your user, so that you can route the user to the most relevant location within your app.
To register the listener, simply add the following line of JS to be ran once after Hurdlr.init({...}):
Hurdlr.registerBITileListener(myBITileCallback);
Whenever a user presses a Business Intelligence CTA in Hurdlr's UI, myBITileCallback will be invoked, with a JSON object as the single argument, containing the following attributes:
| Field | Description | Format |
|---|---|---|
| type | Type of Business Intelligence CTA that was pressed by your user. | Must be one of the following enumerations: Hurdlr.PROFIT_LOSS_TILE,Hurdlr.CASH_FLOW_TILE,Hurdlr.INVOICE_TILE,Hurdlr.EXPENSE_TILE,Hurdlr.REVENUE_TILE,Hurdlr.TAX_TILE,Hurdlr.LINK_ACCOUNT |
An example of the arguments passed to myBITileCallback when a user presses on the Profit & Loss tile is shown below:
{
  type: "PROFIT_LOSS_TILE", // compare to Hurdlr.PROFIT_LOSS_TILE
}
For each of the available BI tile types, we recommend routing your user as follows:
| Type | Ideal Routing |
|---|---|
| Hurdlr.PROFIT_LOSS_TILE | Profit & Loss Report |
| Hurdlr.CASH_FLOW_TILE | Cash Flow Statement |
| Hurdlr.INVOICE_TILE | Invoice Dashboard |
| Hurdlr.EXPENSE_TILE | Expense Dashboard |
| Hurdlr.REVENUE_TILE | Income Dashboard |
| Hurdlr.TAX_TILE | Tax Dashboard |
| Hurdlr.LINK_ACCOUNT | Plaid Link |
Contact us directly at api@hurdlr.com should you need any help understanding how to use BI Tile listeners with the Hurdlr Embedded experience.
8. Displaying tile tooltips
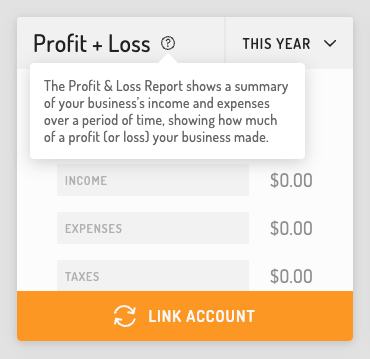
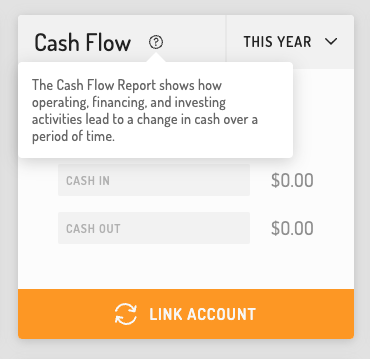
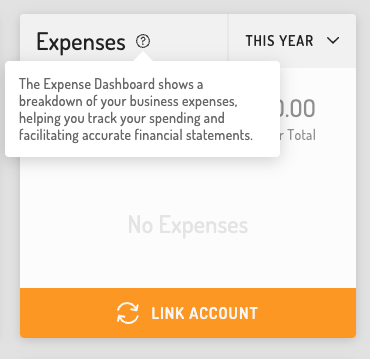
To give your users more context around the Business Intelligence Tiles, you can enable tooltips. Tooltips improve usability by providing quick explanations without cluttering the interface and help users understand tile data. To display them, you can include the optional showTileTooltips parameter in the options object as follows:
Hurdlr.renderScreen(elementId, 'biTiles', { showTileTooltips: true, showOnboarding: true, biTiles: [Hurdlr.biTiles.profitLoss, Hurdlr.biTiles.cashFlow, Hurdlr.biTiles.invoice]});
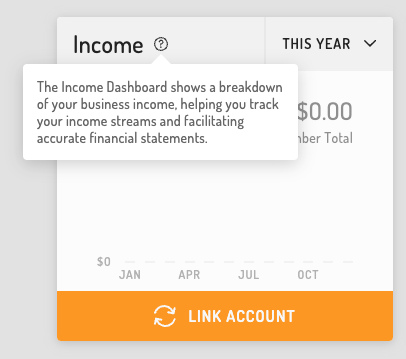
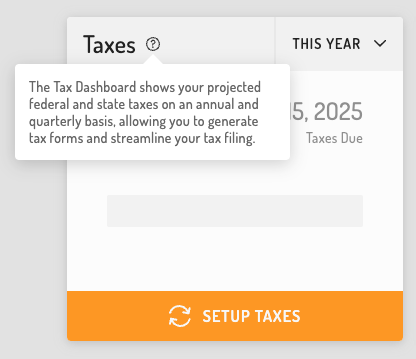
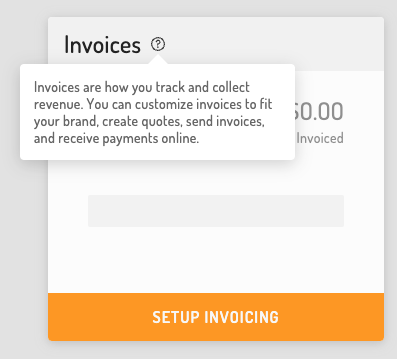
The above code will add tooltips to each of the available tiles. See an example of each tooltip text below:
Updated 3 months ago
