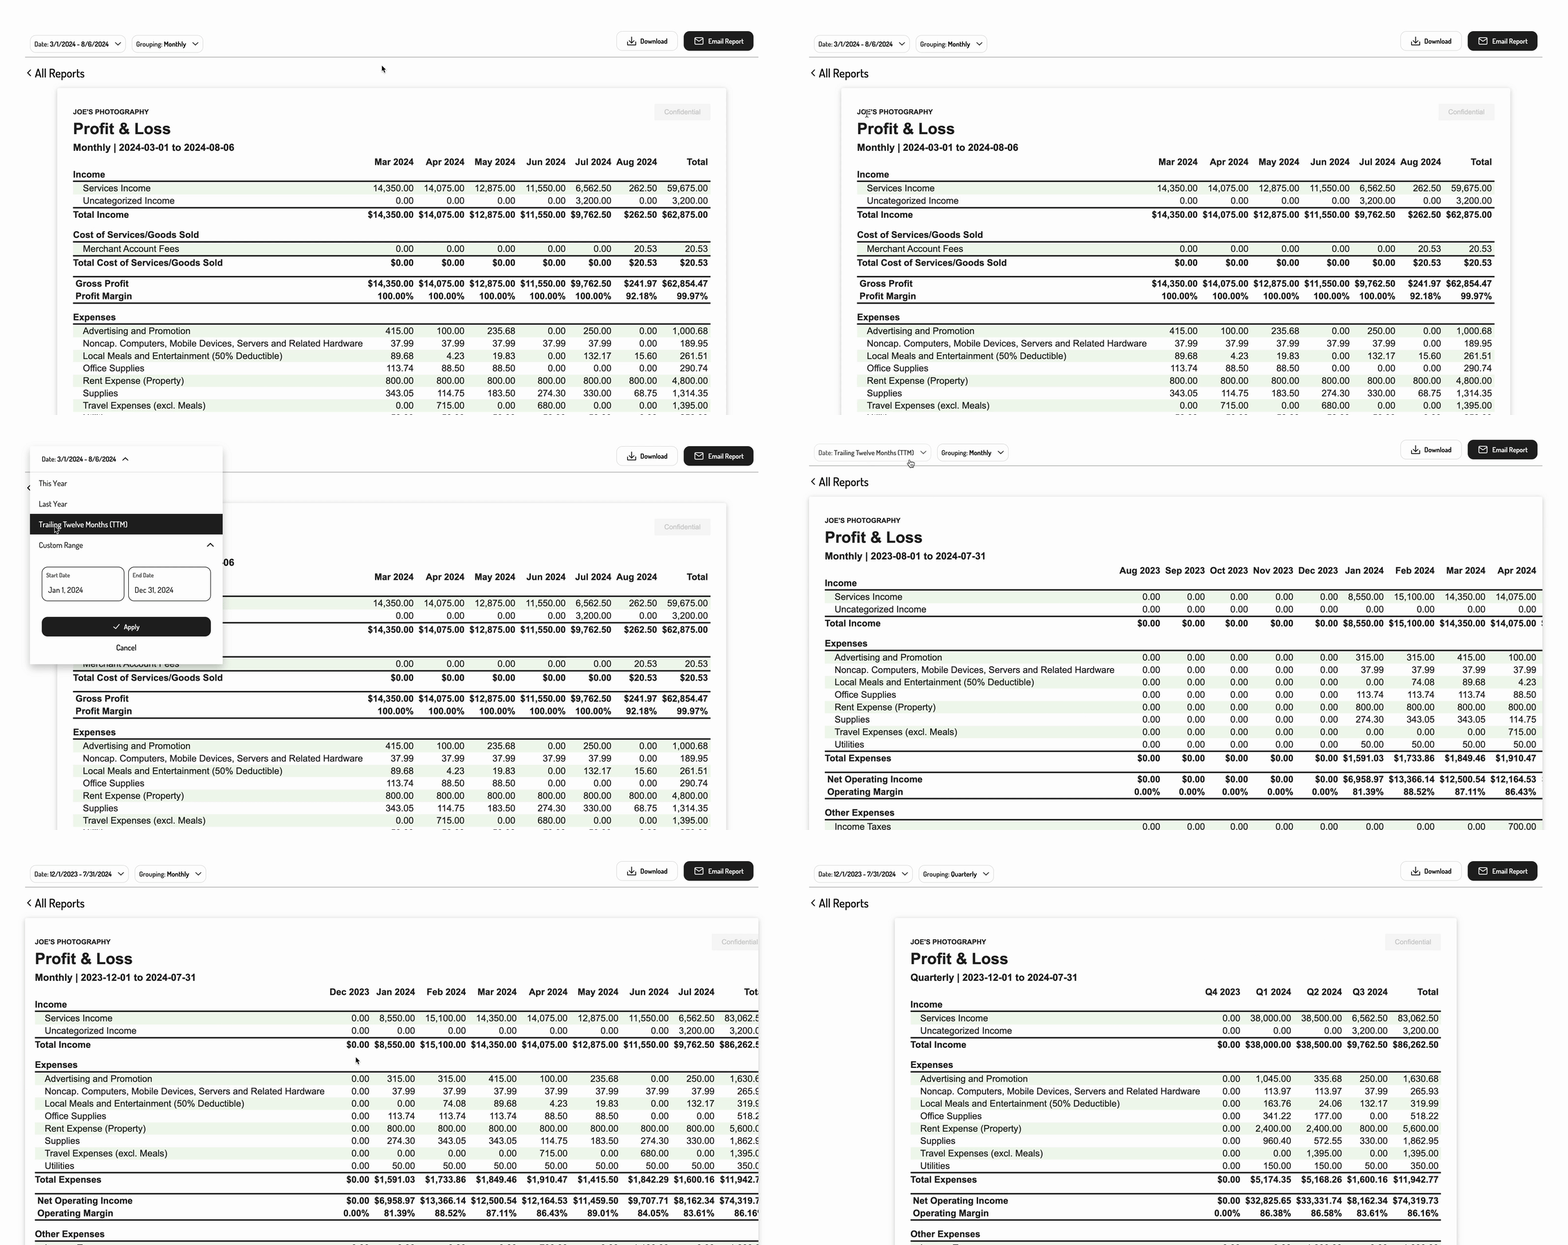
Profit & Loss
The Hurdlr Embedded experience provides you with the capability to embed an interactive (drill-down) Profit & Loss report in your product, with options for customizing the time period grouping of the report.

1. Initializing the Embedded Experience
To initialize the Hurdlr Embedded experience in your project, follow the instructions on Embedding Hurdlr's white-labelled UI.
2. Rendering an interactive Profit & Loss report
To render a Profit & Loss report for a specific user, you will need to provide the elementId parameter, which is the HTML id of the main <div> where you would like the report to render. When your user clicks on the report element, you simply need to invoke the following line of javascript:
Hurdlr.renderReport(elementId, 'profitAndLoss');
3. Populate the desired parameters
You can also pass in some optional parameters to specify the grouping and date range of the report.
| Parameter | Description | Format |
|---|---|---|
| grouping | The time period grouping of the report (e.g. for creating a month-over-month report). | Must be one of the following enumerations:NONE,MONTHLY, QUARTERLY, YEARLY |
| dateRange | The date range type of the report. | Must be one of the following enumerations:THIS_YEAR,LAST_YEAR, CUSTOM |
| beginDate | The beginning date of the report. Should be used withcurrentDate set to CUSTOM. | YYYY-MM-DD |
| endDate | The ending date of the report. Should be used withcurrentDate set to CUSTOM. | YYYY-MM-DD |
Pass these parameters in as an object to the renderReport call as follows:
Hurdlr.renderReport(elementId, 'profitAndLoss', {
  grouping: "MONTHLY",
  dateRange: "CUSTOM",
  beginDate: "2020-01-01",
  endDate: "2020-12-31"
});
Updated about 1 month ago
